Get Your Analytics in One Cool Visual [Infographic Tool]
Posted by Annie May / March 21, 2013 analyticsGoogle Analyticsinfographicvisual traffic summarywebsite performance data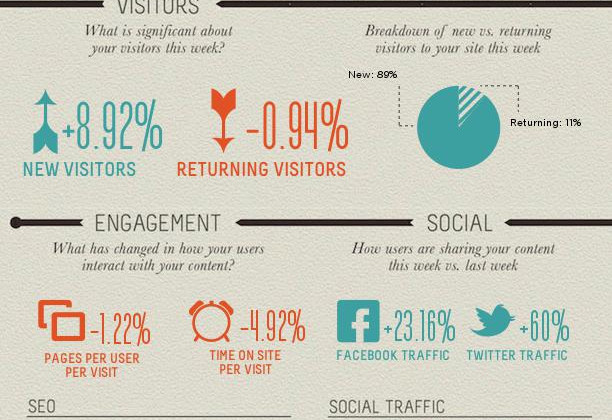
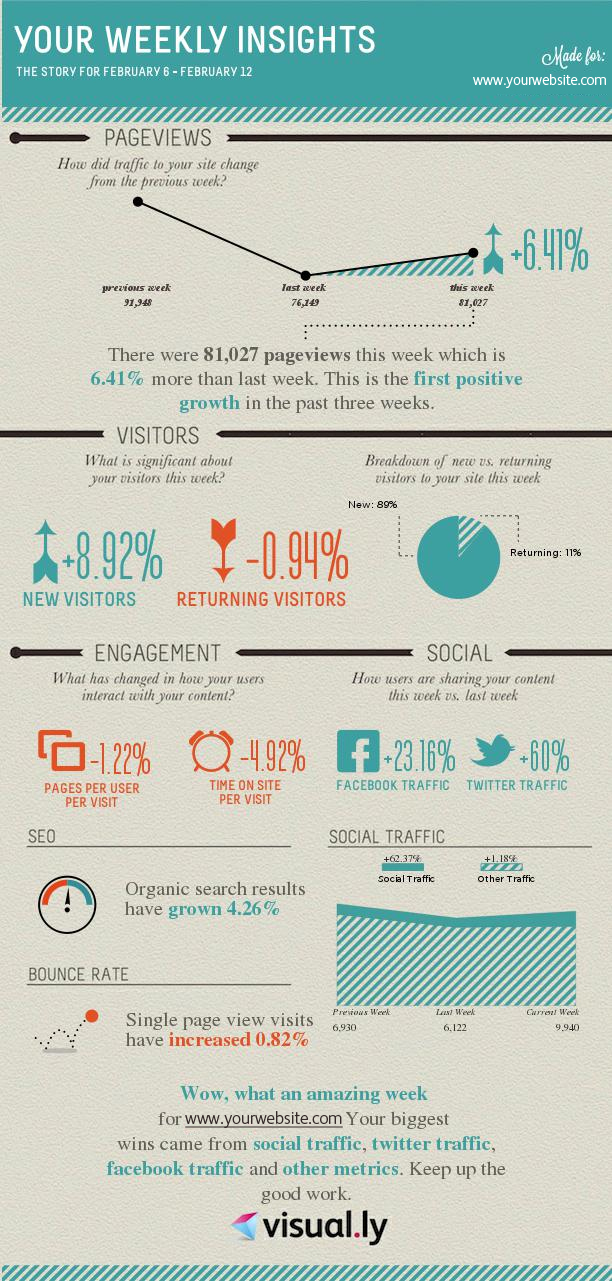
Get a visual traffic summary of your website performance data with Visually’s free Google Analytics Report.
From Visual.ly.


Hi! What about those who don´t have a clue about Google Analytics. We always seem to forget those who are starting anew in the world of SEO and building their own websites… It seems no one cares much about thousands of DIY webmasters… Fear not! I wish I had the time to duplicate all my content in English, but sadly my time is limited, so it´s all in Spanish at the moment. Hope some of you have a deep knowledge of Spanish so you can check out some of my posts, which are precisely dedicated to those of you who don´t have a profound knowledge of SEO, or in this case, Google Analytics. I have written a series of 4 posts explaining step by step how to register your page, what the main terms mean and most importantly, how to interpret the data thrown by Google Analytics. I hope you enjoy them.