A timeline of Earth’s average temperature since the last Ice Age glaciation
Posted by staff / October 26, 2016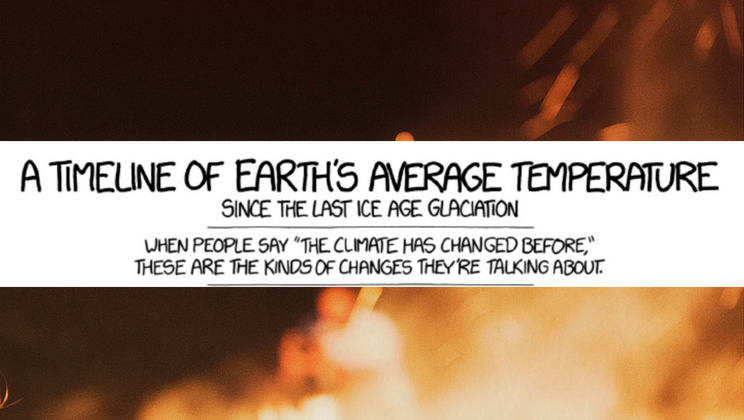
Sometimes, it takes a comic to fully grasp a deadly serious situation. This could be one of those times.
We hear all too often that current global warming is just one of those things that happens on planet Earth.
Randall Monroe at XKCD.com provides some desperately needed perspective.

Via xkcd.


Bizarre distortion of reality — I guess I should expect nothing less from a comic strip. It claims Medieval warming was just regional and didn’t effect global average temperatures and the same for the ‘Little Ice Age.” True propaganda.
WAFJ, so you want everyone to believe this is the true mean temperature of the earth, based on 1961 to 1990 records, you are truly a comic.Left wing Joseph Goebbels propaganda, he would be proud of you………..
Gee, why isn’t the author intellectually honest enough to post Earth’s average global temp over the last 200 million years or more? And not the man made global warming bogus graph that resets the delta point of the graph via a contrived average of temperatures taken from 1940-1960 which alters the entire view of climate history, but a graph of just the temp.
Because it would show we’re still in a Cool Period, which we are; that average global temp will rise 11F whether man is on the planet or not, which it will. We’re still in a 3.5 million year Cool Period caused by the closing of the Panama Isthmus which triggered a series of 23 Glacial Periods.
A more accurate take on the same timeline, with similar but more humorous cartoon illustration can be found here … https://wattsupwiththat.com/2016/09/20/josh-takes-on-xkcds-climate-timeline/